27th Annex to the Directors’ Report
Disclosure pursuant to Clause 12 of SEBI (Employee Stock Option Scheme and Employee Stock Purchase Scheme) Guidelines, 1999
Details of stock options granted, vested, exercised and lapsed during the year under review are as under :
| Scheme(s) | Grant Price () | Options Granted | Options Vested | Options Exercised | Options Lapsed | Total Options in force as on March 31, 2013# |
|---|---|---|---|---|---|---|
| ESOS – 2007 | 164.65 | – | – | 12,060^ | – | – |
| ESOS – 2011 | 317.85 | – | 2,90,186 | 3,80,637* | 33,947 | 6,75,075 |
| ESOS -2011-Tr II | 548.80 | – | 12,285 | – | 7,600 | 40,950 |
^ One (1) share of 10/- was allotted on exercise of one (1) stock option.
* Five (5) shares of 2/- were allotted on exercise of one (1) stock option in view of the share split.
# Total Options in force is a total of options vested and not yet exercised and options not yet vested.
Other details are as under :
| Options granted during the year : | Nil | ||||||||||||||||||||||||||||
| Pricing formula for the Scheme(s) : | N.A. | ||||||||||||||||||||||||||||
| Money realised by exercise of options : | The Company received 12.30 crores on account of stock options exercised during the year. |
||||||||||||||||||||||||||||
| Details of options granted to : (i) Directors & Senior managerial personnel; (ii) Any other employee who receives a grant in any one year of option amounting to 5% or more of option granted during that year; (iii) identified employees who were granted option, during any one year, equal to or exceeding 1% of the issued capital of the Company at the time of grant : | Since there was no grant during the year, hence not applicable | ||||||||||||||||||||||||||||
| Variation of terms of options : | Nil | ||||||||||||||||||||||||||||
| Diluted Earnings Per Share (EPS) pursuant to issue of shares on exercise of option calculated in accordance with Accounting Standard (AS) – 20 : | 8.16 | ||||||||||||||||||||||||||||
| Disclosure of difference between the employee compensation cost using intrinsic value of stock options instead of fair value of the options and the impact of difference on profits and on EPS of the Company : | ESOS 2011 and ESOS 2011 Tranche II : Since the options were granted at the market price, the intrinsic value of the option is nil. Consequently the accounting value of the option (compensation cost) was also nil. However, if fair value of the options according to Black-Scholes–Mertons Option Pricing Model was to be used for calculating the accounting value of the option, the compensation cost would have been 1.89 crores, the profit after tax would have been lesser by 1.89 crores and basic and diluted EPS would have been 8.10 & 8.05 respectively. | ||||||||||||||||||||||||||||
| Weighted-average exercise prices and weighted-average fair values of options : | ESOS 2011 : All the options were granted at an exercise price of 317.85 per option and hence the weighted average price is 317.85 per option. The weighted average fair value of the option (using the Black-Scholes–Mertons Option Pricing Model) works out to 51, 67 and 75 for the options vesting on February 10, 2012, February 10, 2013 and February 10, 2014 respectively.
ESOS 2011 Tranche II: All the options were granted at an exercise price of 548.80 per option and hence the weighted average price is 548.80 per option. The weighted average fair value of the option (using the Black-Scholes–Mertons Option Pricing Model) works out to 70, 101 and 116 for the options vesting on October 25, 2012, October 25, 2013 and October 25, 2014 respectively. |
||||||||||||||||||||||||||||
| A description of the method and significant assumptions used during the year to estimate the fair values of options, at the time of grant including the following weighted-average information:(a) risk-free interest rate, (b) expected life, (c) expected volatility of share price (d) dividend yield rate (e) the price of underlying share in the market at the time of option grant : |
|
||||||||||||||||||||||||||||
|
|||||||||||||||||||||||||||||
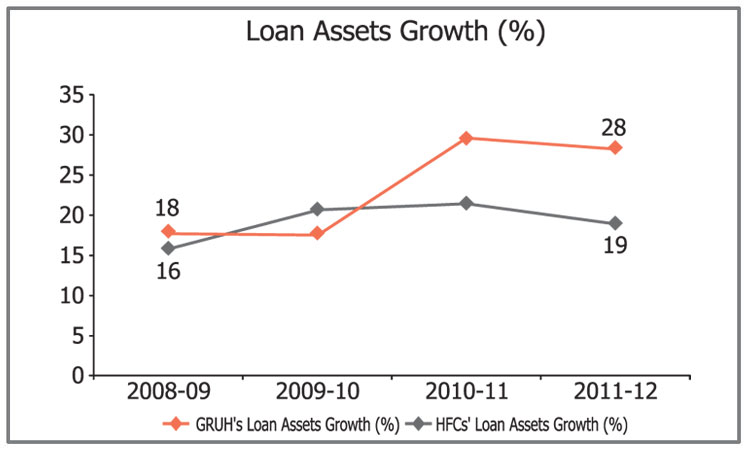
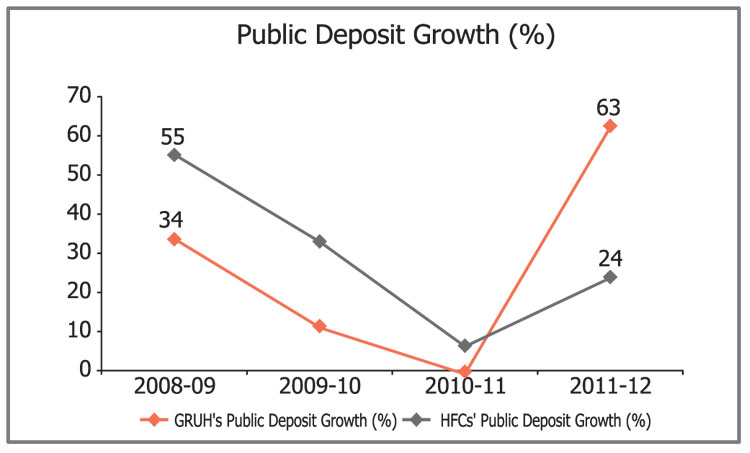
GRUH Vis-a-vis HFCs (*)
- Graph:Loan Assets Growth (%)